urban dashboard
georeferenced data analysis
dashboard display indicators
analysis of urban phenomena on geo-referenced data
WiseTown Urban Dashboard is an application that allows you to create customized views to compare cartographic information with statistical data and real-time data from satellite systems. All dashboards offer the highest degree of configurability and allow effective analysis of urban phenomena. Among the many possibilities, there are time-lapse satellite dashboards for comparing the evolution of the phenomenon over time; dashboards for analyzing public parks and gardens for reports on the state of health of plants and vegetation; dashboards on the degree of urban land consumption with ISPRA and ISTAT data; dashboards with social and economic data on the population; dashboards on quality of life indicators; dashboards on the analysis of mobility flows; dashboards for monitoring the safety of the city and the territory.
Our interactive dashboards are map-based and contain statistical data analysis boxes with the ability to activate filters and selections to differentiate the display of information.
WiseTown Urban Dashboard, alone or integrated with other modules for the city, is the innovation that simplifies the life of the citizen and the work of administrators.
take a look at our urban dashboards
Green City
improve urban green spaces
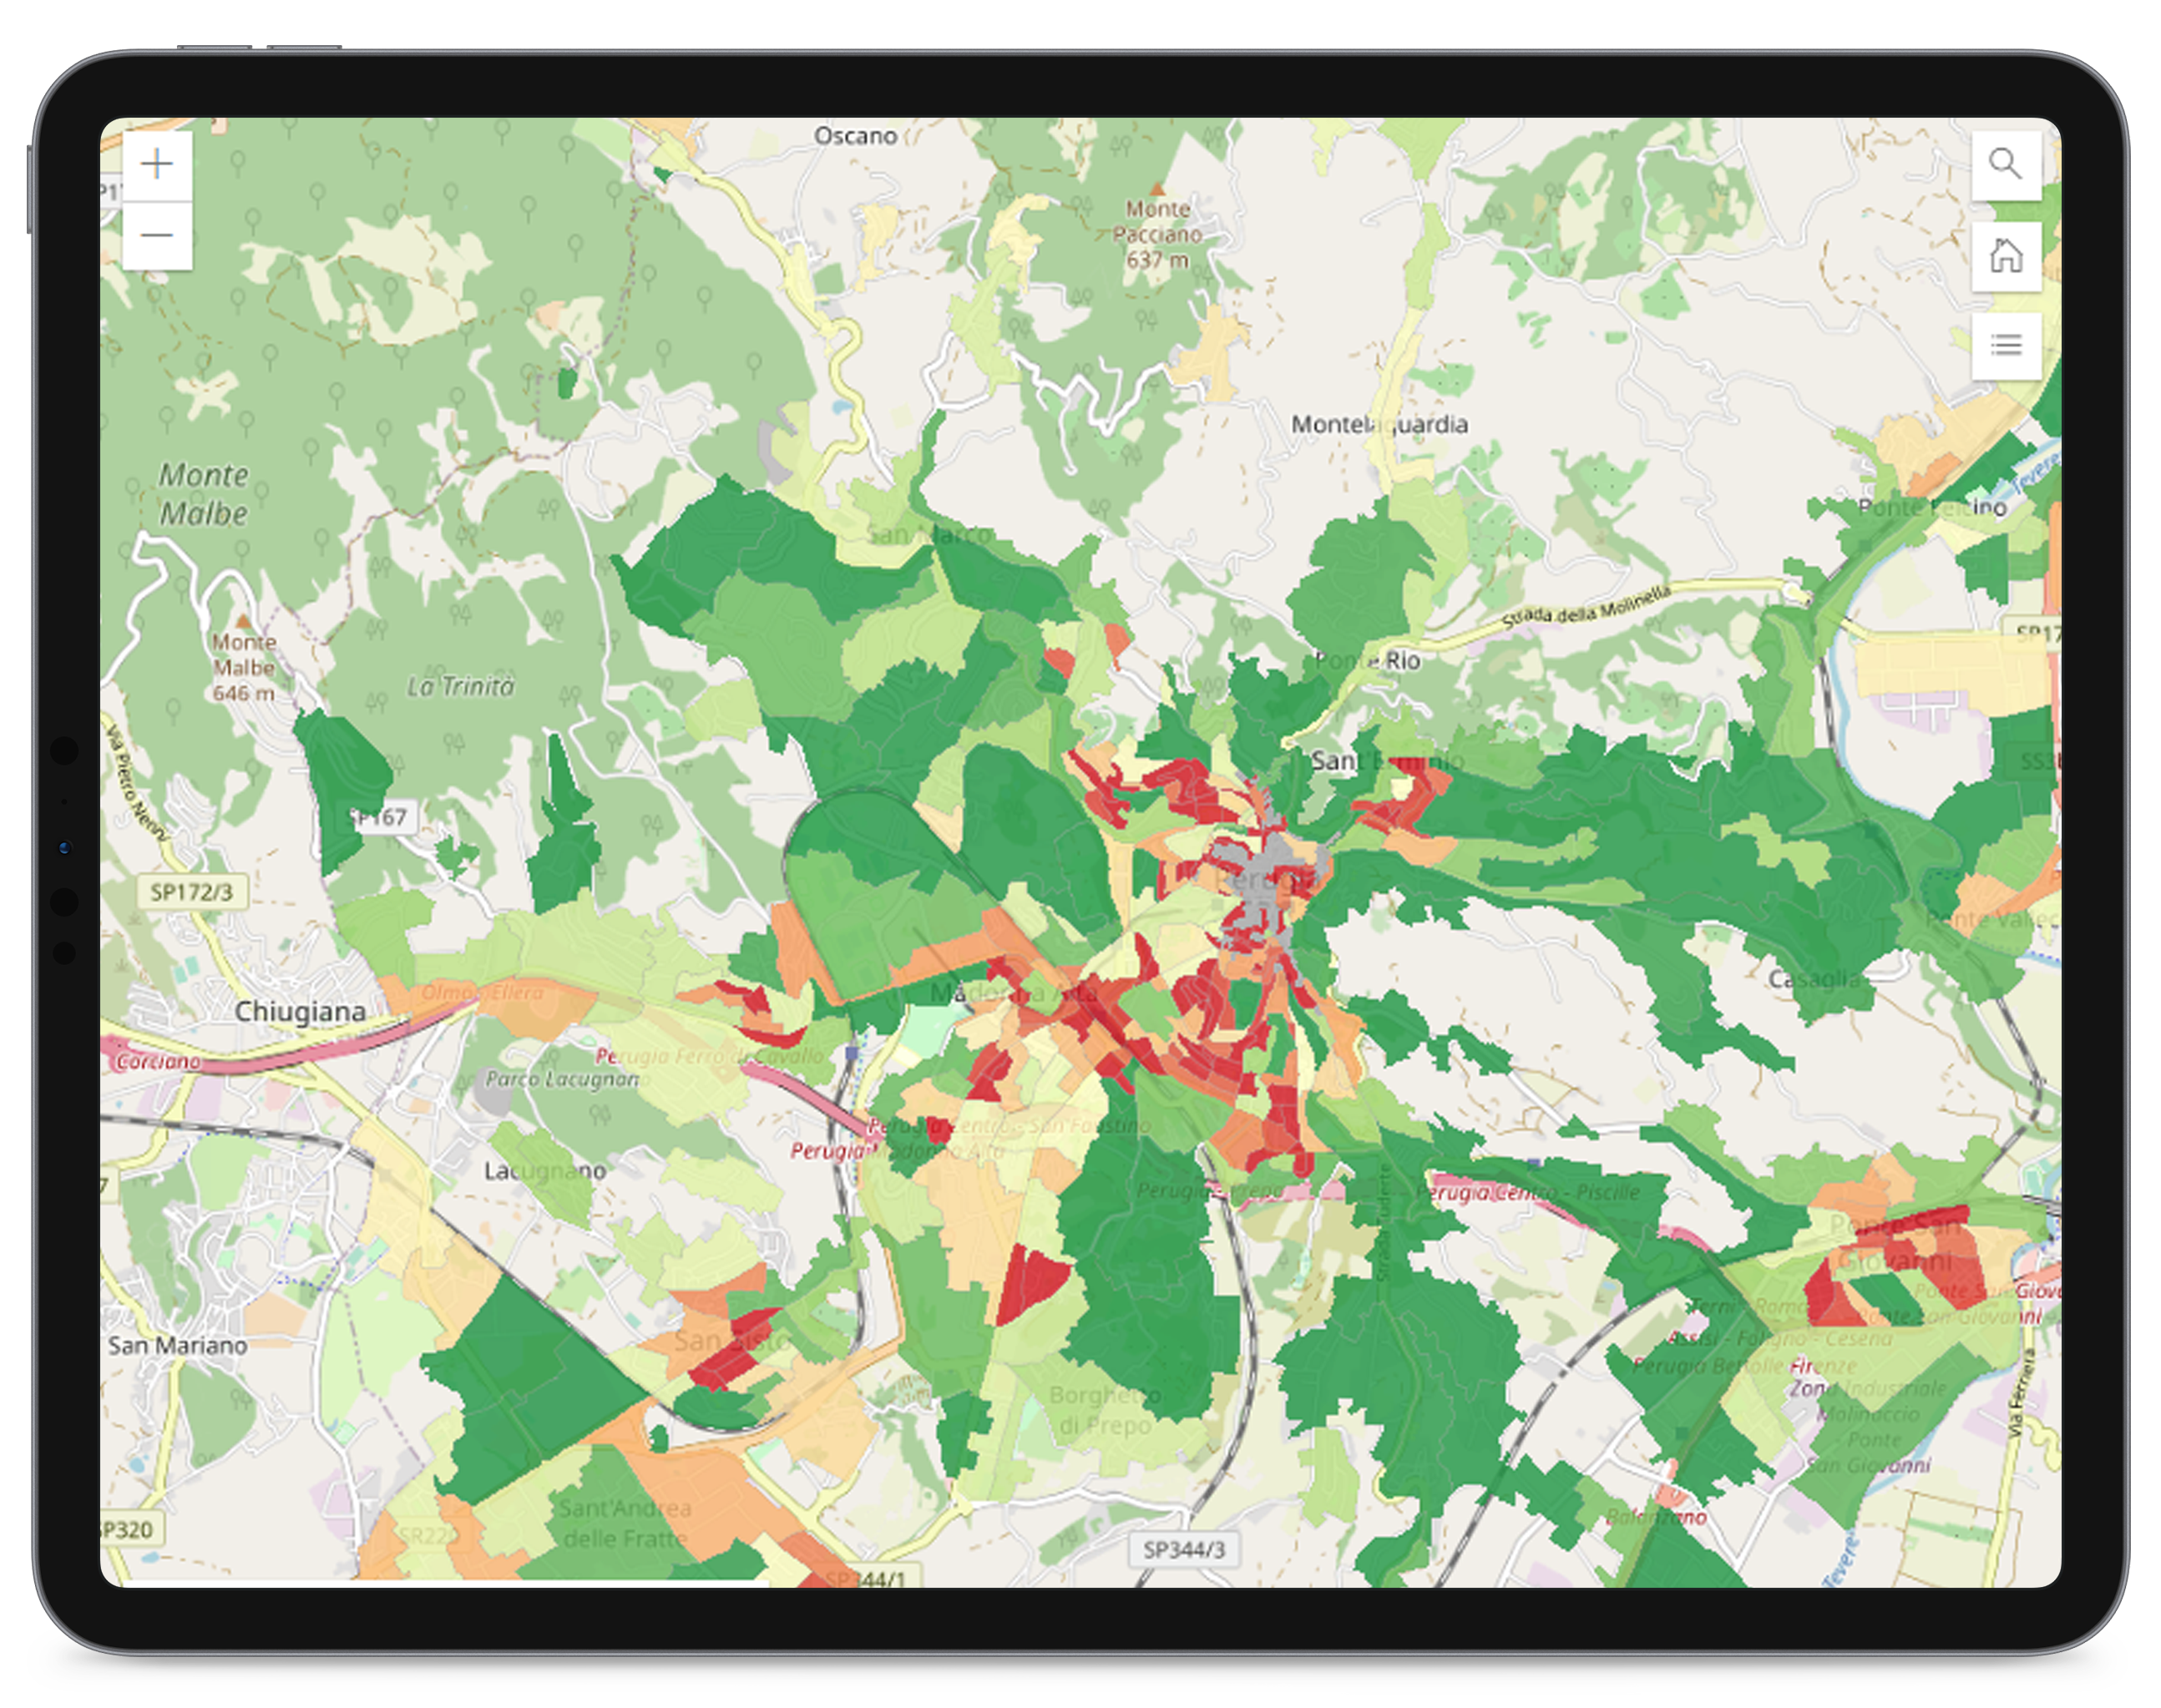
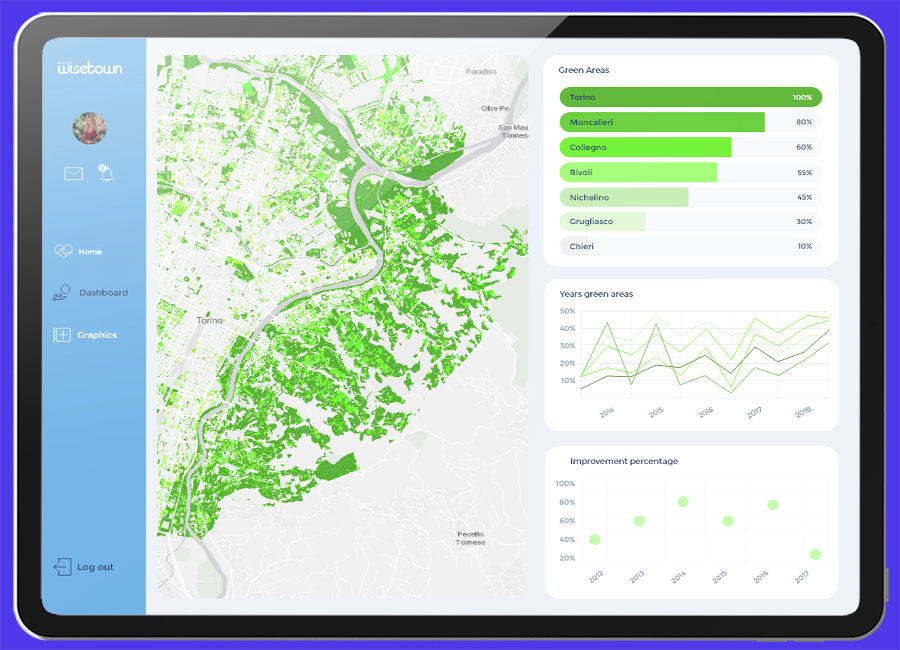
This dashboard can be used to analyze, understand, and monitor urban green spaces. Quality indexes and strong data have driven scenarios to allow the analysis of public parks, gardens, and other green areas for reports on the health of plants and vegetation to make understand how urban green spaces can be improved and how this can impact citizens’ health. This tool integrates satellite data and crosses them with census data to reveal the connections between the environment and the population.
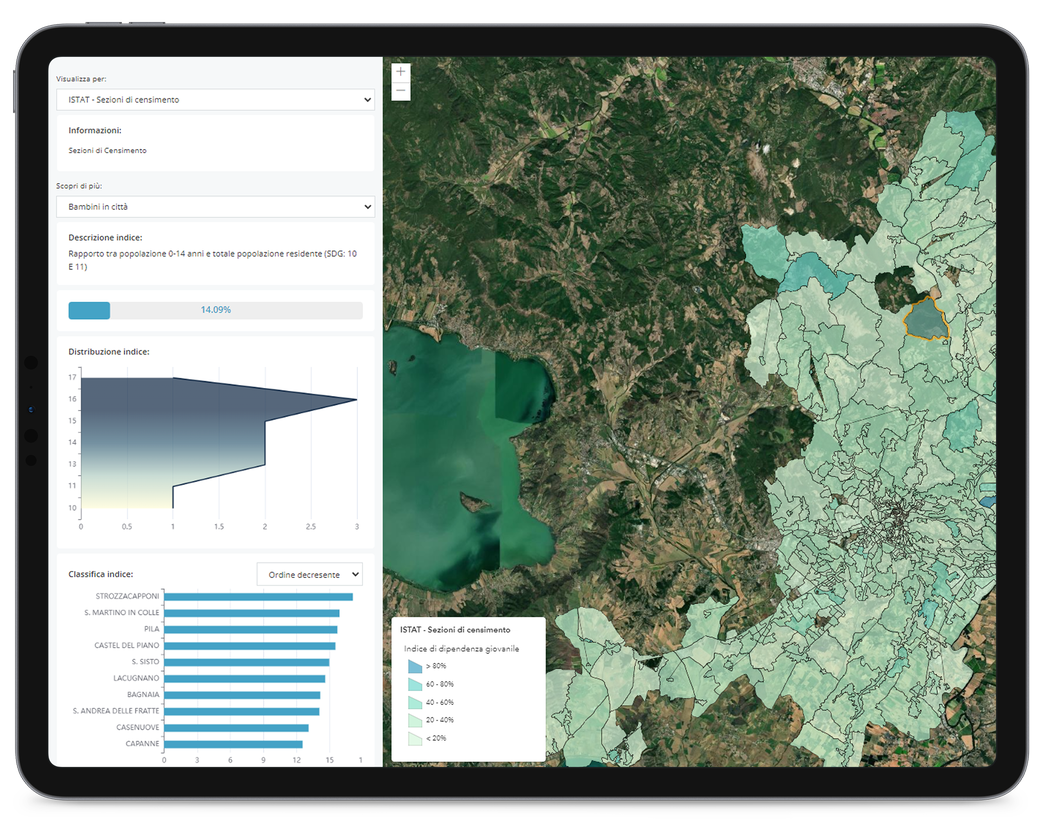
Cities are made up of citizens and it is really important to keep into consideration data of this main component. A constant update of the distribution of families, children, young people, the elderly, and other indices on residents makes it possible to offer more suitable services and infrastructures to better respond to the needs of citizens.
Welfare
offer more suitable services and infrastructures
Welfare
offer more suitable services and infrastructures

Cities are made up of citizens and it is really important to keep into consideration data of this main component. A constant update of the distribution of families, children, young people, the elderly, and other indices on residents makes it possible to offer more suitable services and infrastructures to better respond to the needs of citizens.
Economics
respond to citizen needs
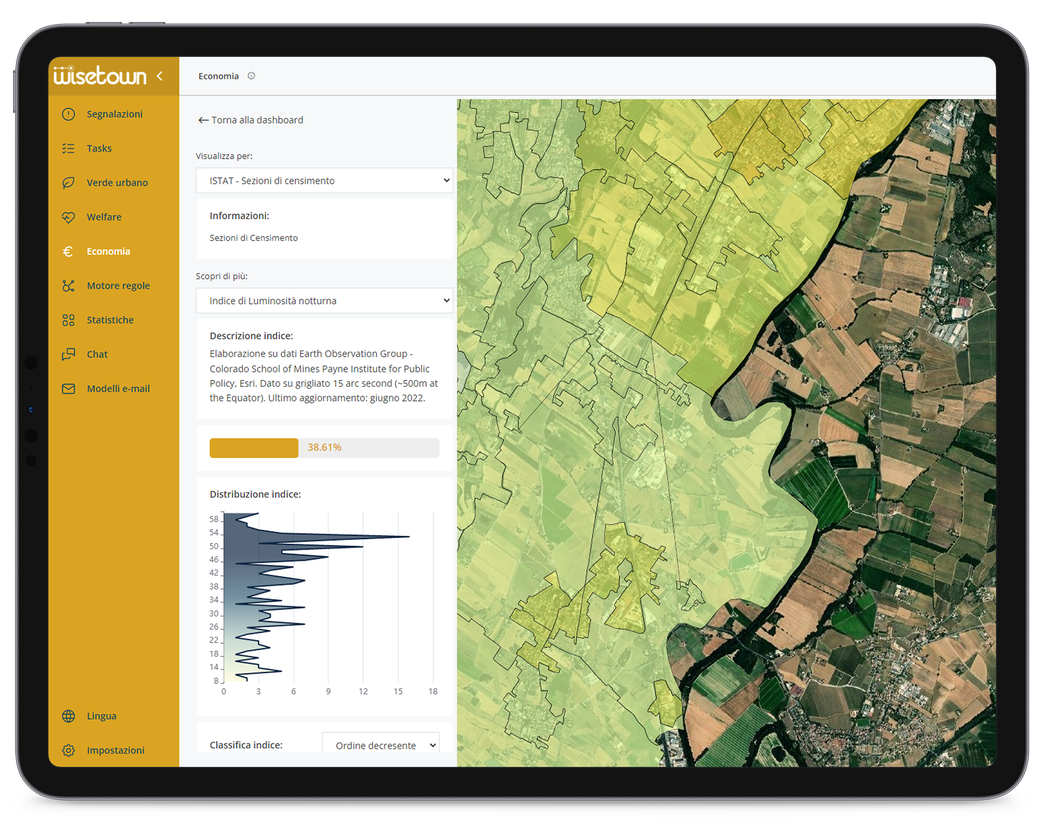
The equitable and sustainable well-being of citizens and companies is a priority to create a smart and livable city. The dashboard allows viewing the evolution of economic sustainability over time, highlighting any inequalities in the conditions of well-being related to the territory, level of education, gender, and generation.
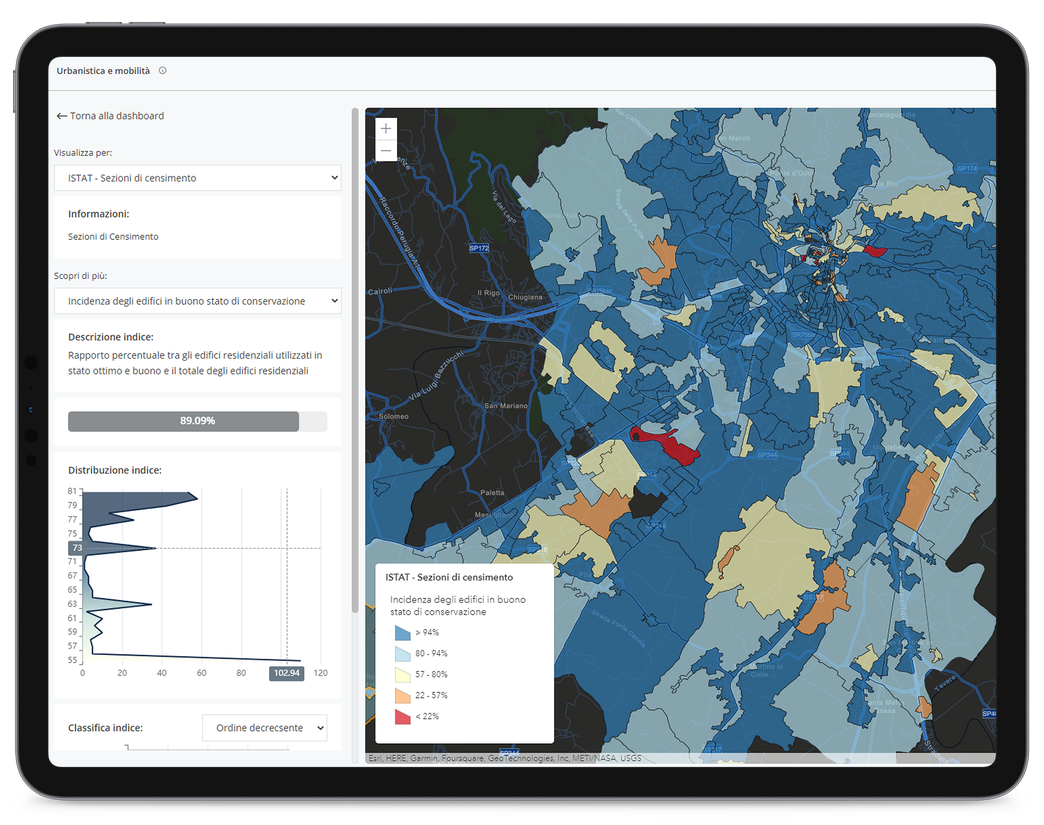
The application is crucial for a broad vision of our cities. Maps with indexes, parameters, and predictive analysis are a valuable support in the drafting of a new sustainable urban plan, tailored to the citizen and careful to urban environmental challenges. With a few clicks, you can have constant updates on population density, building / not building areas, roads, public areas (services, parking), etc.
A powerful tool to simulate urban transition and transformation to achieve sustainable and resilient cities.
Urban planning
design a new sustainable urban plan
Urban planning
design a new sustainable urban plan

The application is crucial for a broad vision of our cities. Maps with indexes, parameters, and predictive analysis are a valuable support in the drafting of a new sustainable urban plan, tailored to the citizen and careful to urban environmental challenges. With a few clicks, you can have constant updates on population density, building / not building areas, roads, public areas (services, parking), etc.
A powerful tool to simulate urban transition and transformation to achieve sustainable and resilient cities.
how it works
WiseTown’s Urban Dashboards allow administrators to visualize and interact with information based on collected data
problem
without urban dashboard
It is essential for administrations to have total control over the data and complete awareness of the extent of phenomena in the city. To understand how to intervene, it is necessary to visualize the problem, interpret the data and extrapolate the needs.
solution
with urban dashboard
An information visualization dashboard allows the decision-maker to interpret the criticalities linked to any issue: mobility, land use, urban green and much more. A correct visualization of information guarantees the effectiveness of the intervention.


