
Todi, smart and sustainable municipality
Analysis and monitoring of the city’s strategic issues
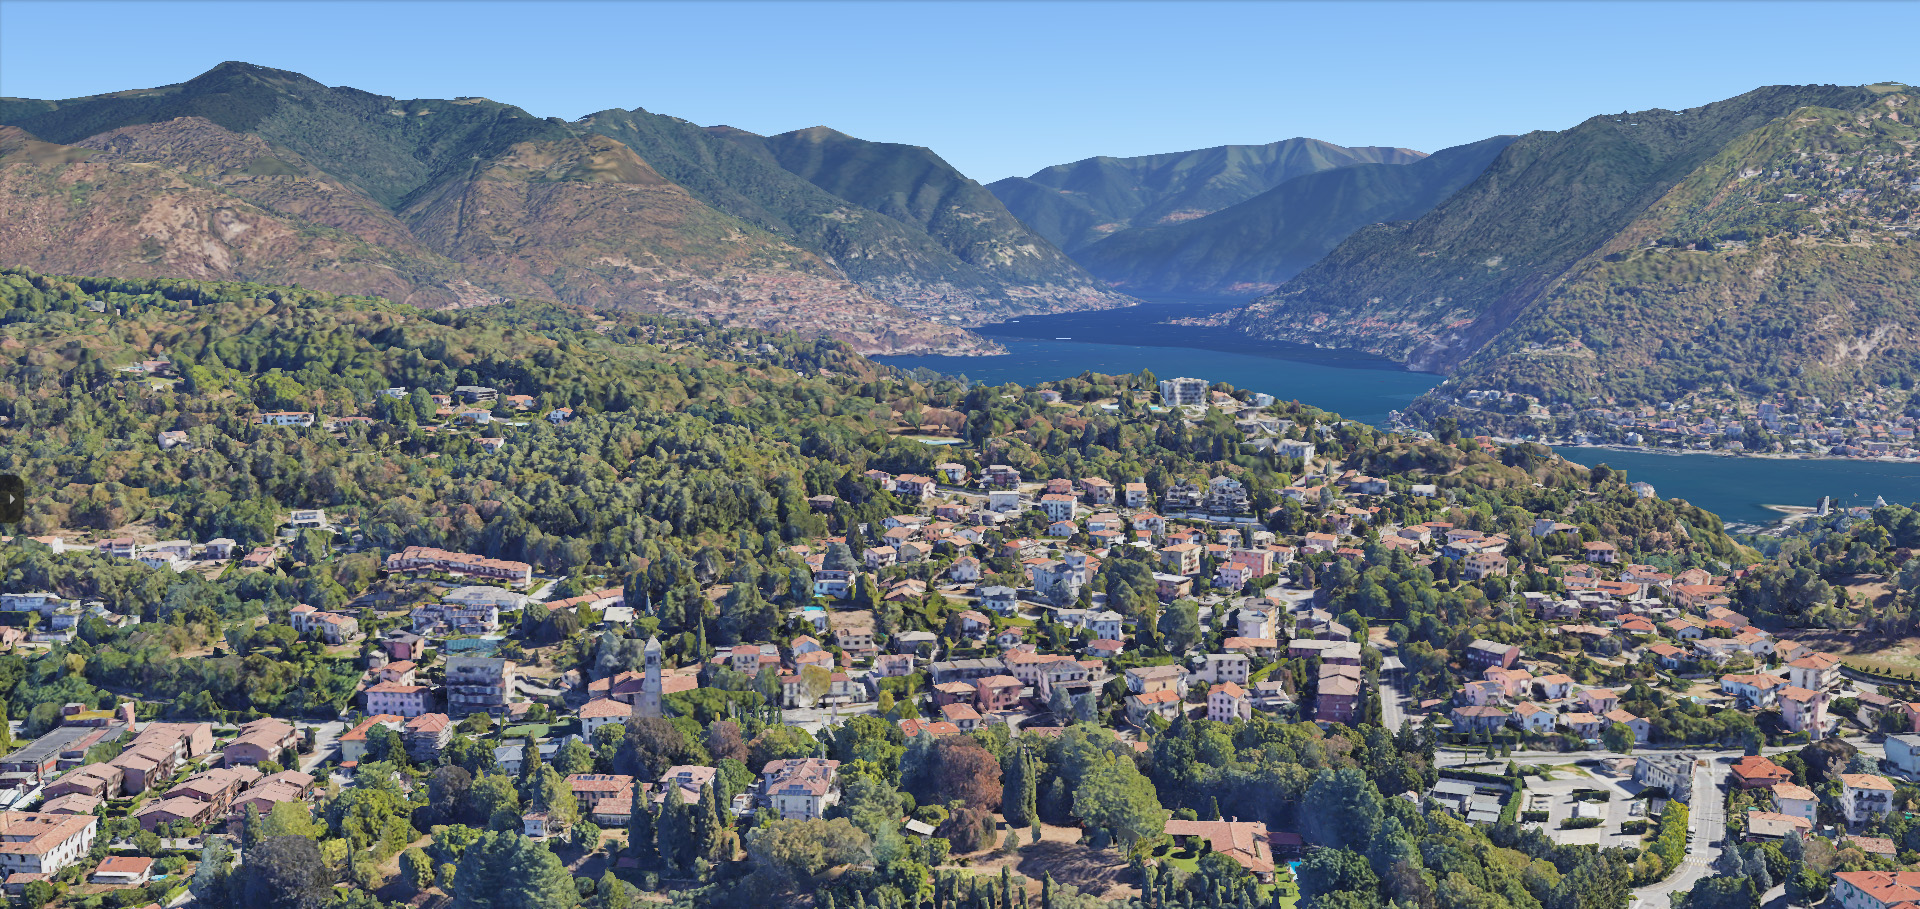
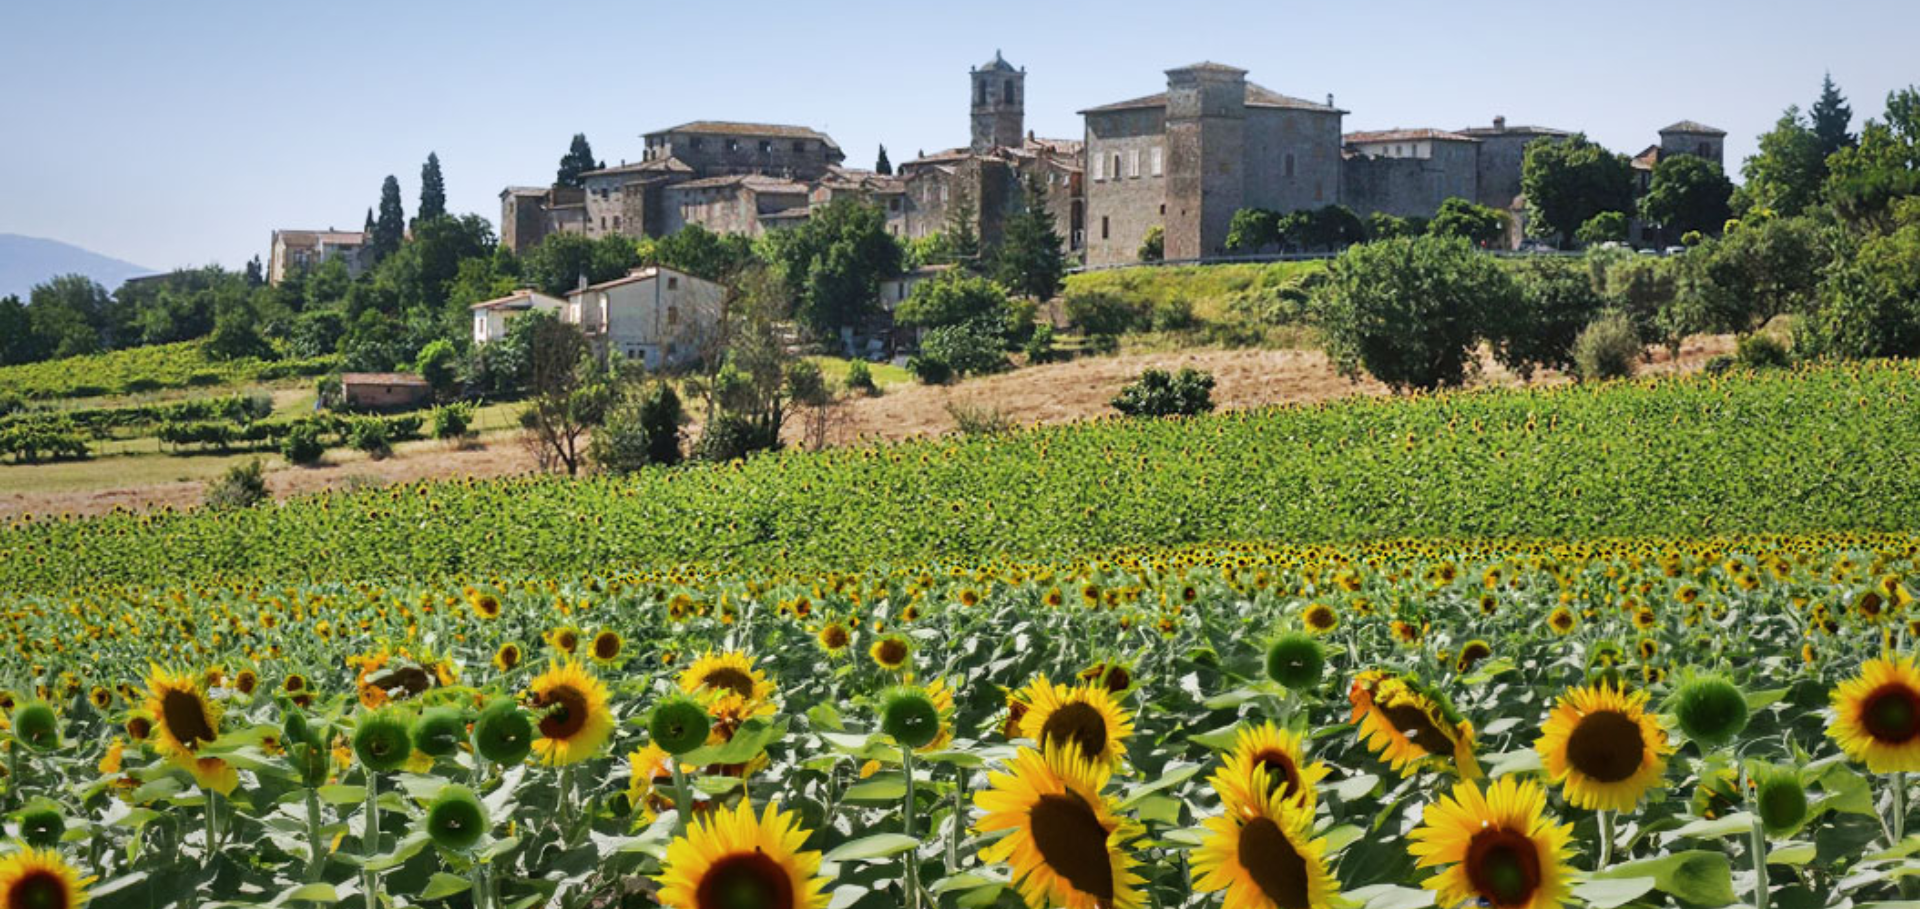
The territory of the municipality of Todi, located on a hill in the province of Perugia, is rich in art, culture, traditions and flavors. The city has gained international notoriety thanks to the title of “most livable city in the world,” awarded to it following research by Professor Richard S. Levine of the University of Kentucky in the United States.

City of Todi. Photo by Magna Umbria
Todi, smart and sustainable municipality
The Municipality of Todi is striving to become a smart and sustainable city by adopting new technologies proper to the smart city model. Using the WiseTown platform, the public administration can easily access data and information to make evidence-based decisions with the aim of promoting technological innovation, digitization and creating a city attentive to citizens’ needs, environmental sustainability and inclusiveness.
What distinguishes Todi’s new solutions?
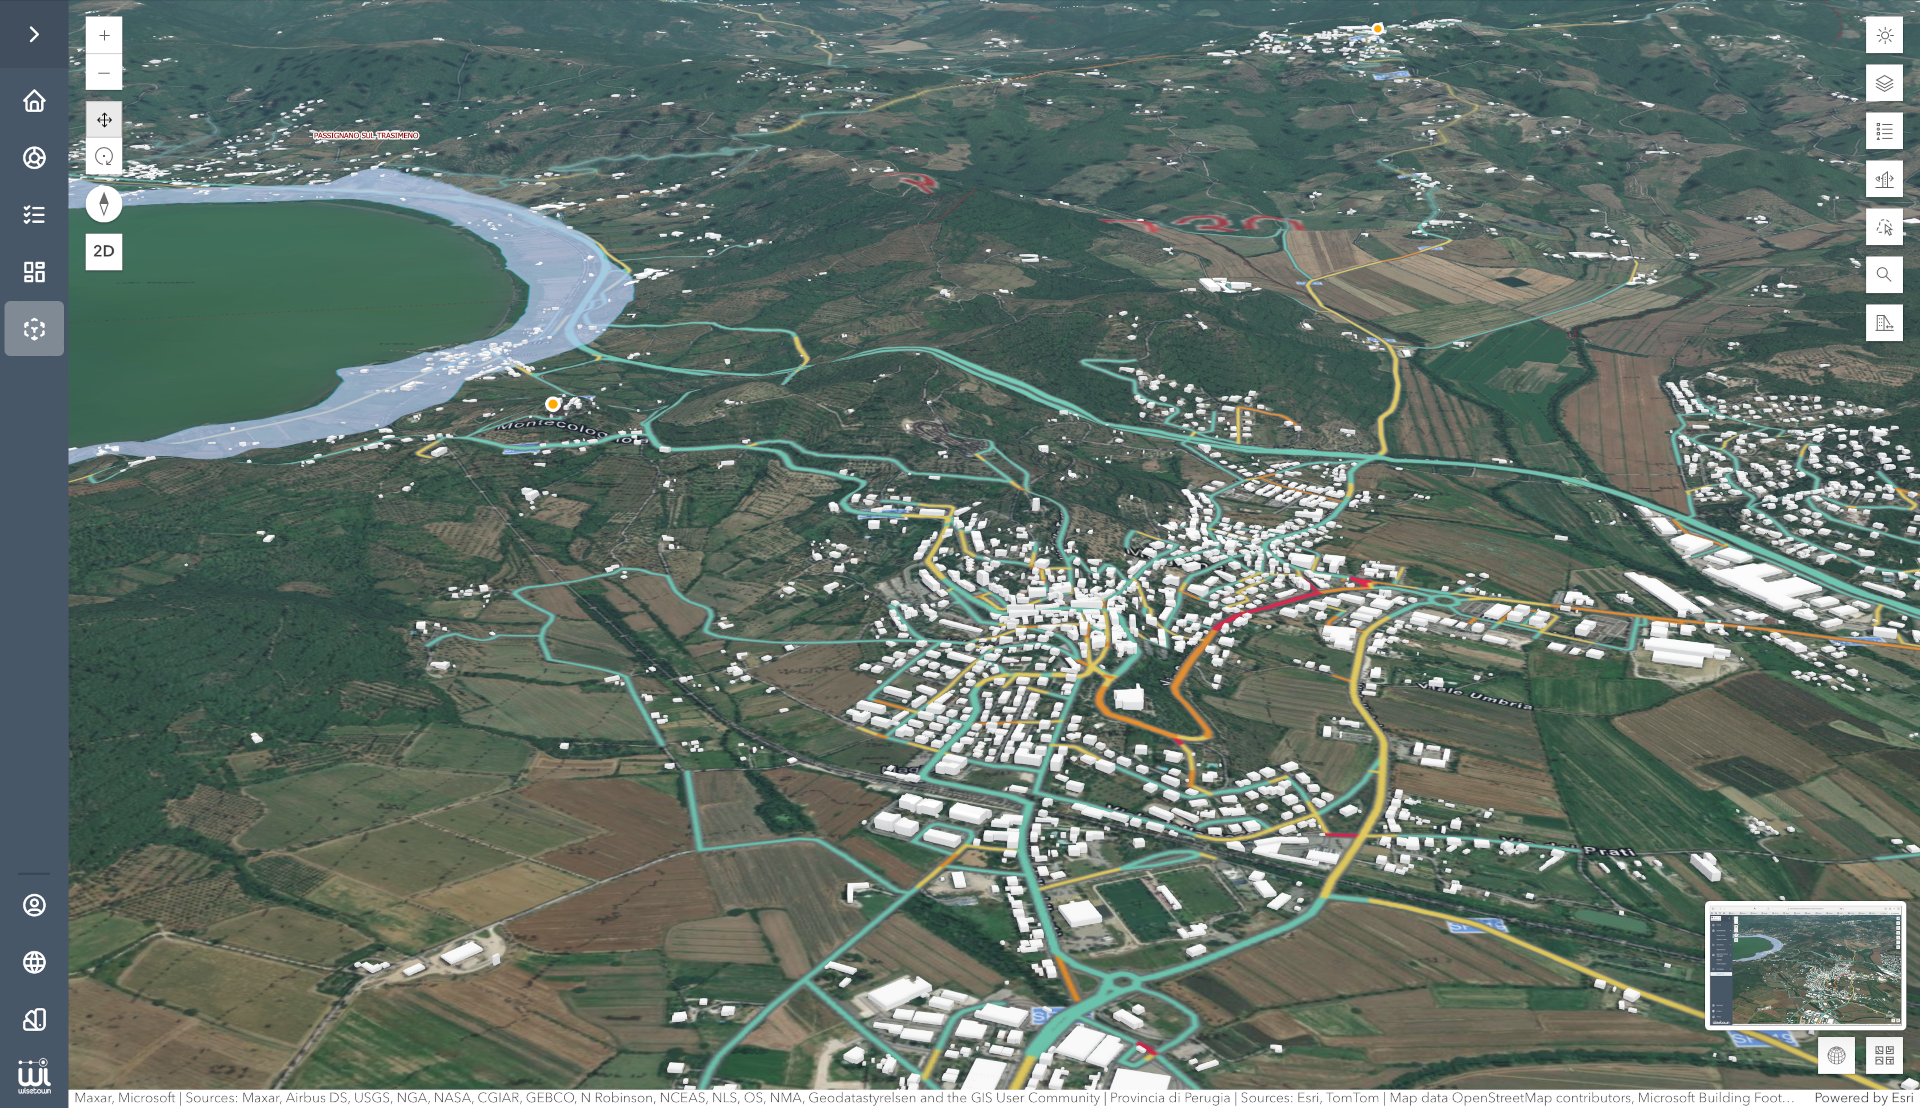
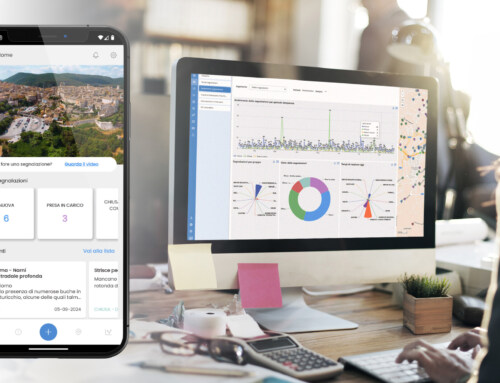
The city government is thus equipping itself with a platform that offers visualization and monitoring tools for the city’s most strategic issues. Among the various applications accessible in the WiseTown system, which is currently being tested, are the Urban Dashboards that were created to facilitate the integration, analysis and visualization of urban data.
There are two key areas for close monitoring through the Platform: social welfare and urban green.
Welfare Dashboard to monitor citizens’ welfare
The Welfare Dashboard gives access to data on the social fabric that makes up the city, allowing the system to overlay layers of data on the map to highlight the distribution of children, youth, the elderly and foreigners, neighborhood by neighborhood; numbers that not only tell the story of the city’s demographic distribution, but also translate into information about the needs of the various categories.
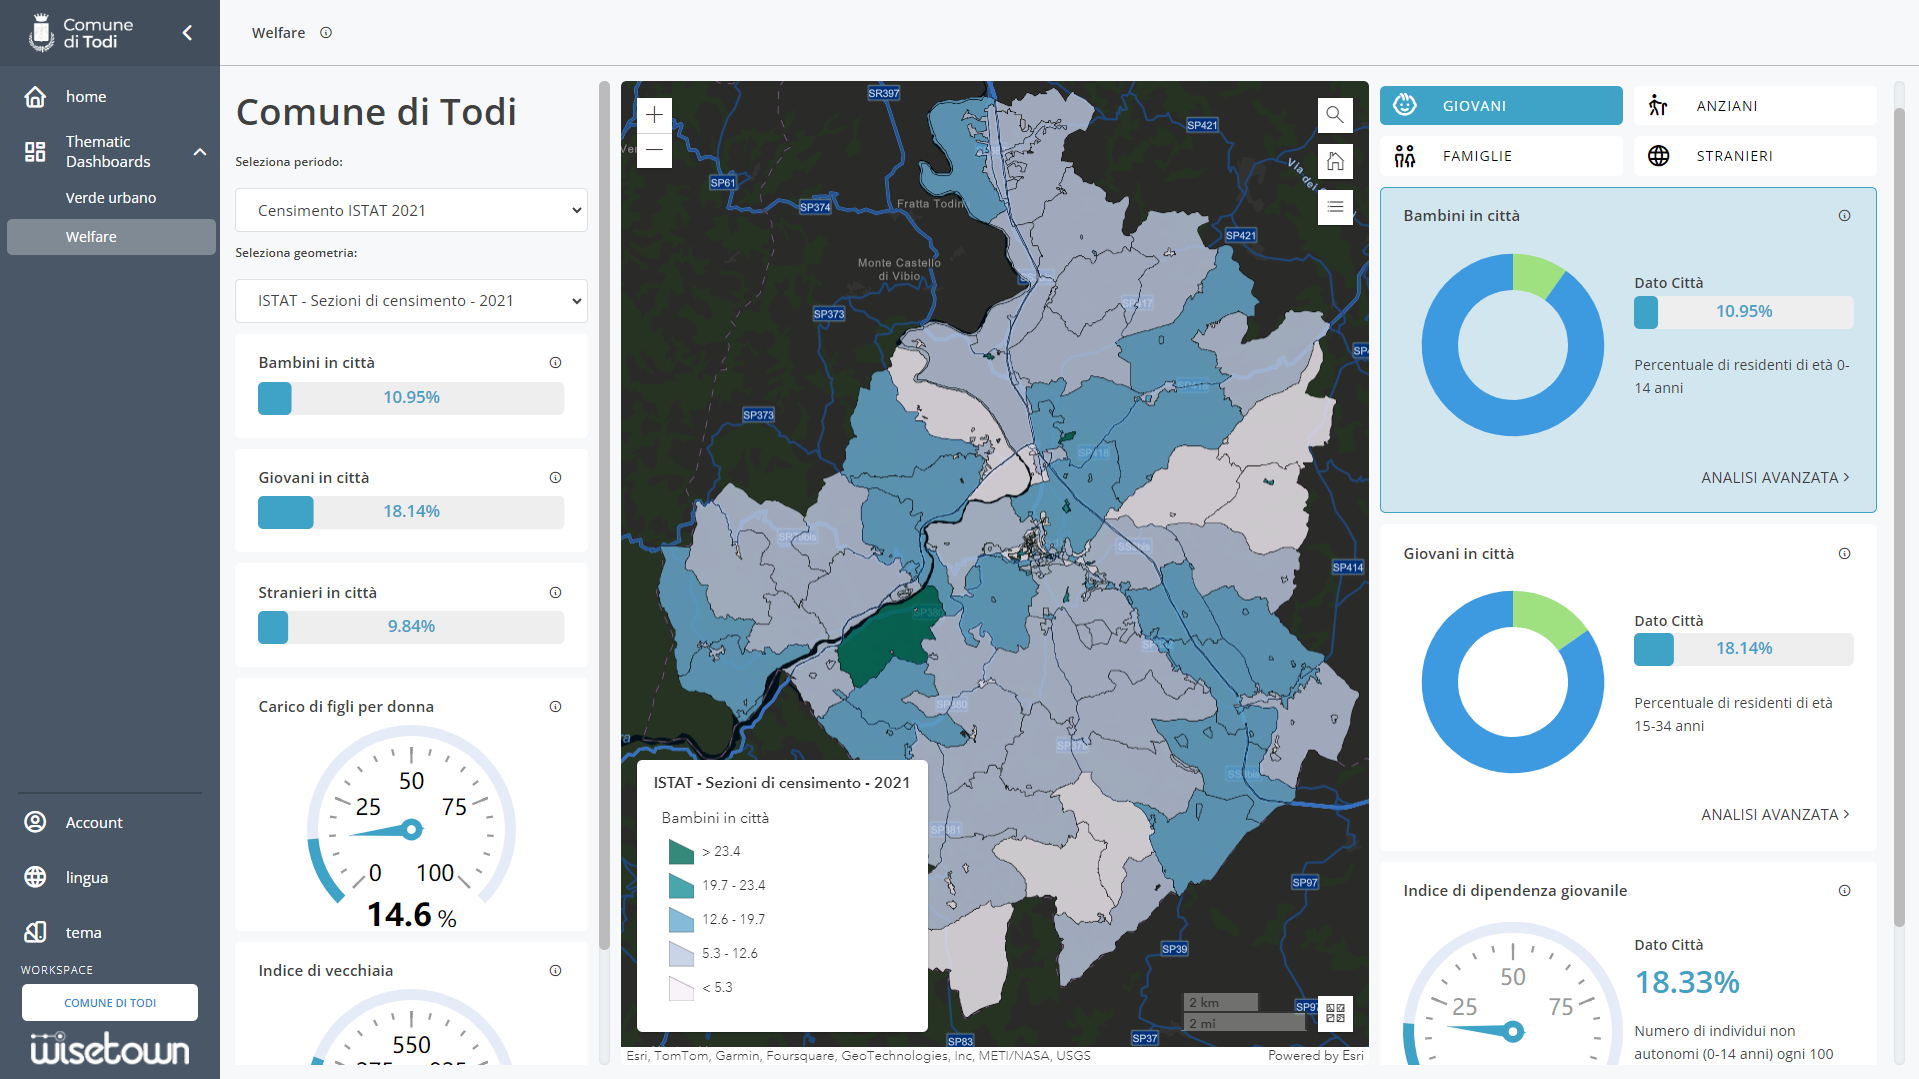
The Welfare Dashboard of the Municipality of Todi
For example, if a neighborhood boasts a significant concentration of children, it will be more appropriate to adapt parks of playgrounds and other services in line with the needs of young citizens; in parallel, in territories characterized by a high presence of the elderly, it will be appropriate to prepare services, infrastructure aimed at supporting this category.
An inclusive approach that puts each and every citizen at the center, ensuring equitable and targeted attention to different needs.
Dashboard of green
Another available dashboard (dashboard of green) provides objective data to assess the impact of administrative policies on public greenery, ensuring compliance with Law No. 10/2013 as it facilitates the assessment of the density and increase of greenery present in the territory, including parks, gardens, wooded areas, flowerbeds and tree-lined avenues, as well as the availability of such space per inhabitant with the possibility of relating this information to fragile categories.
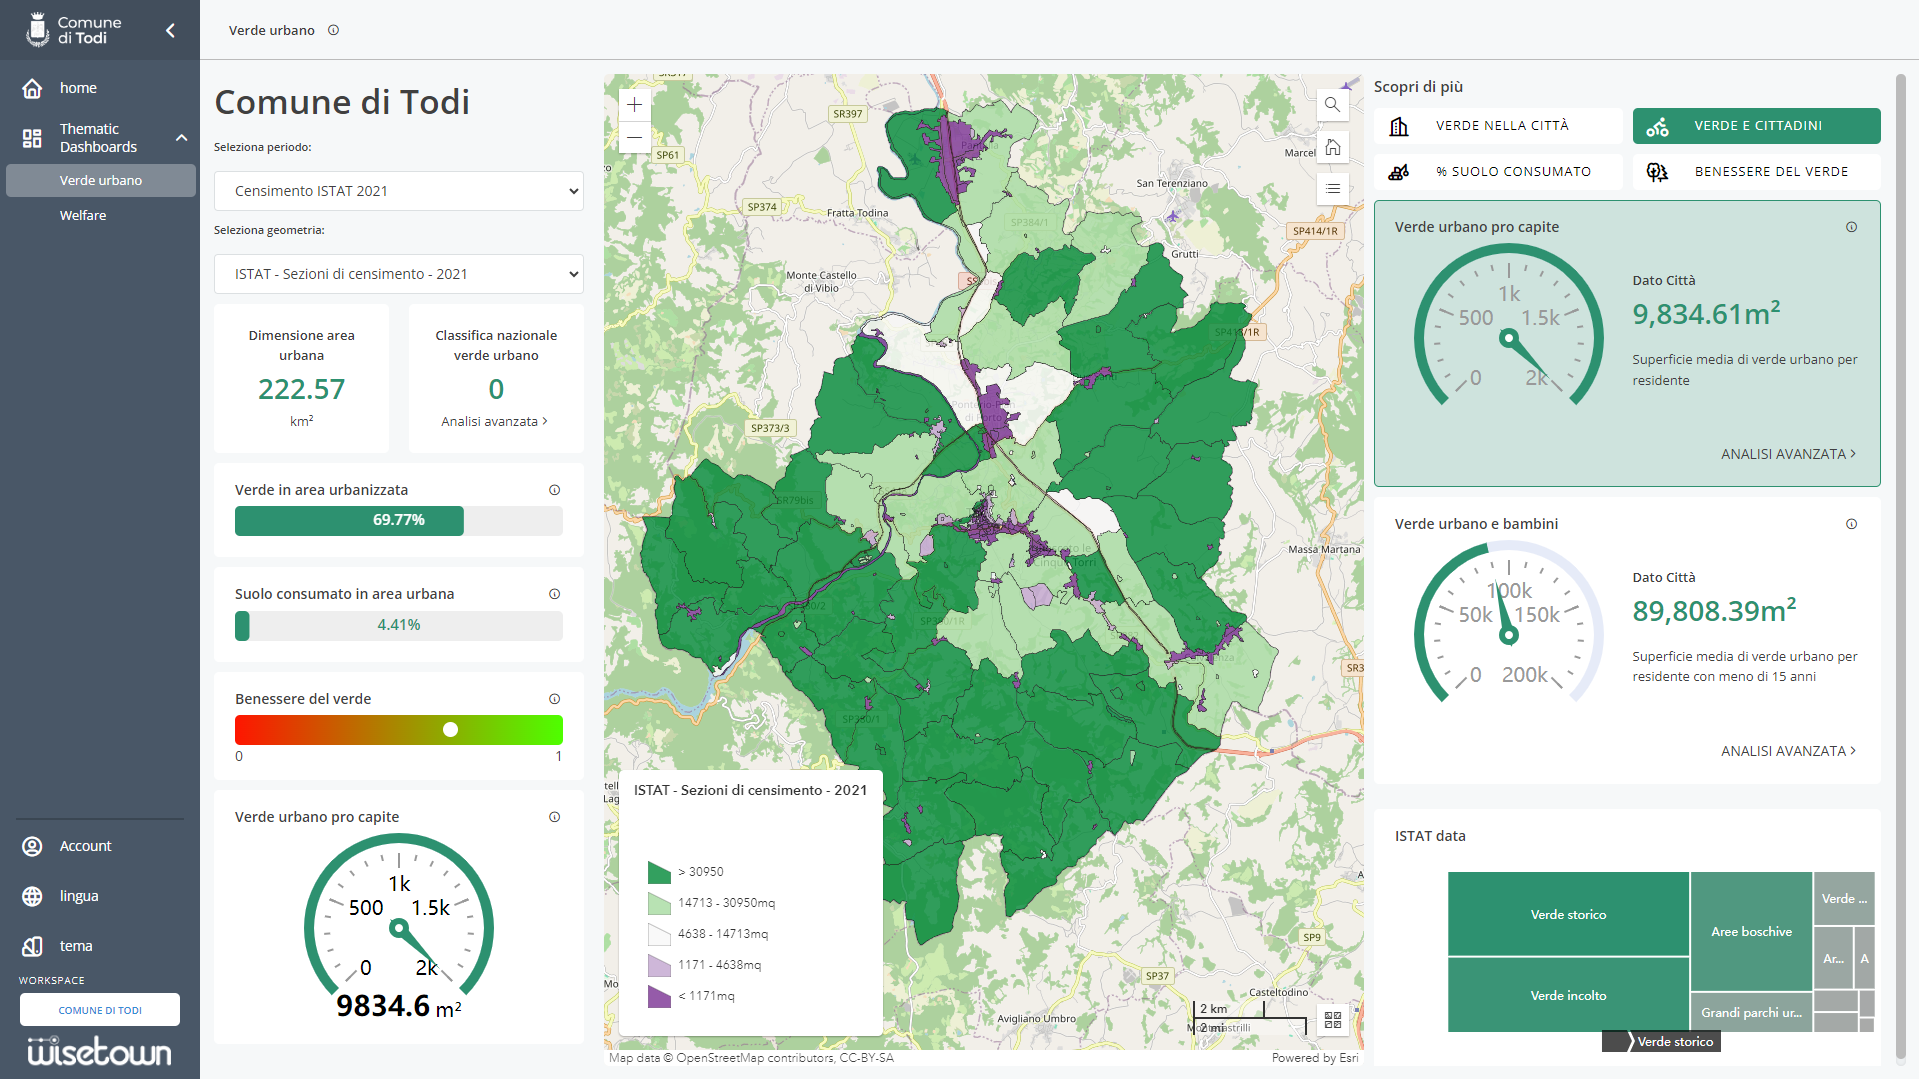
The City of Todi’s dashboard of green.
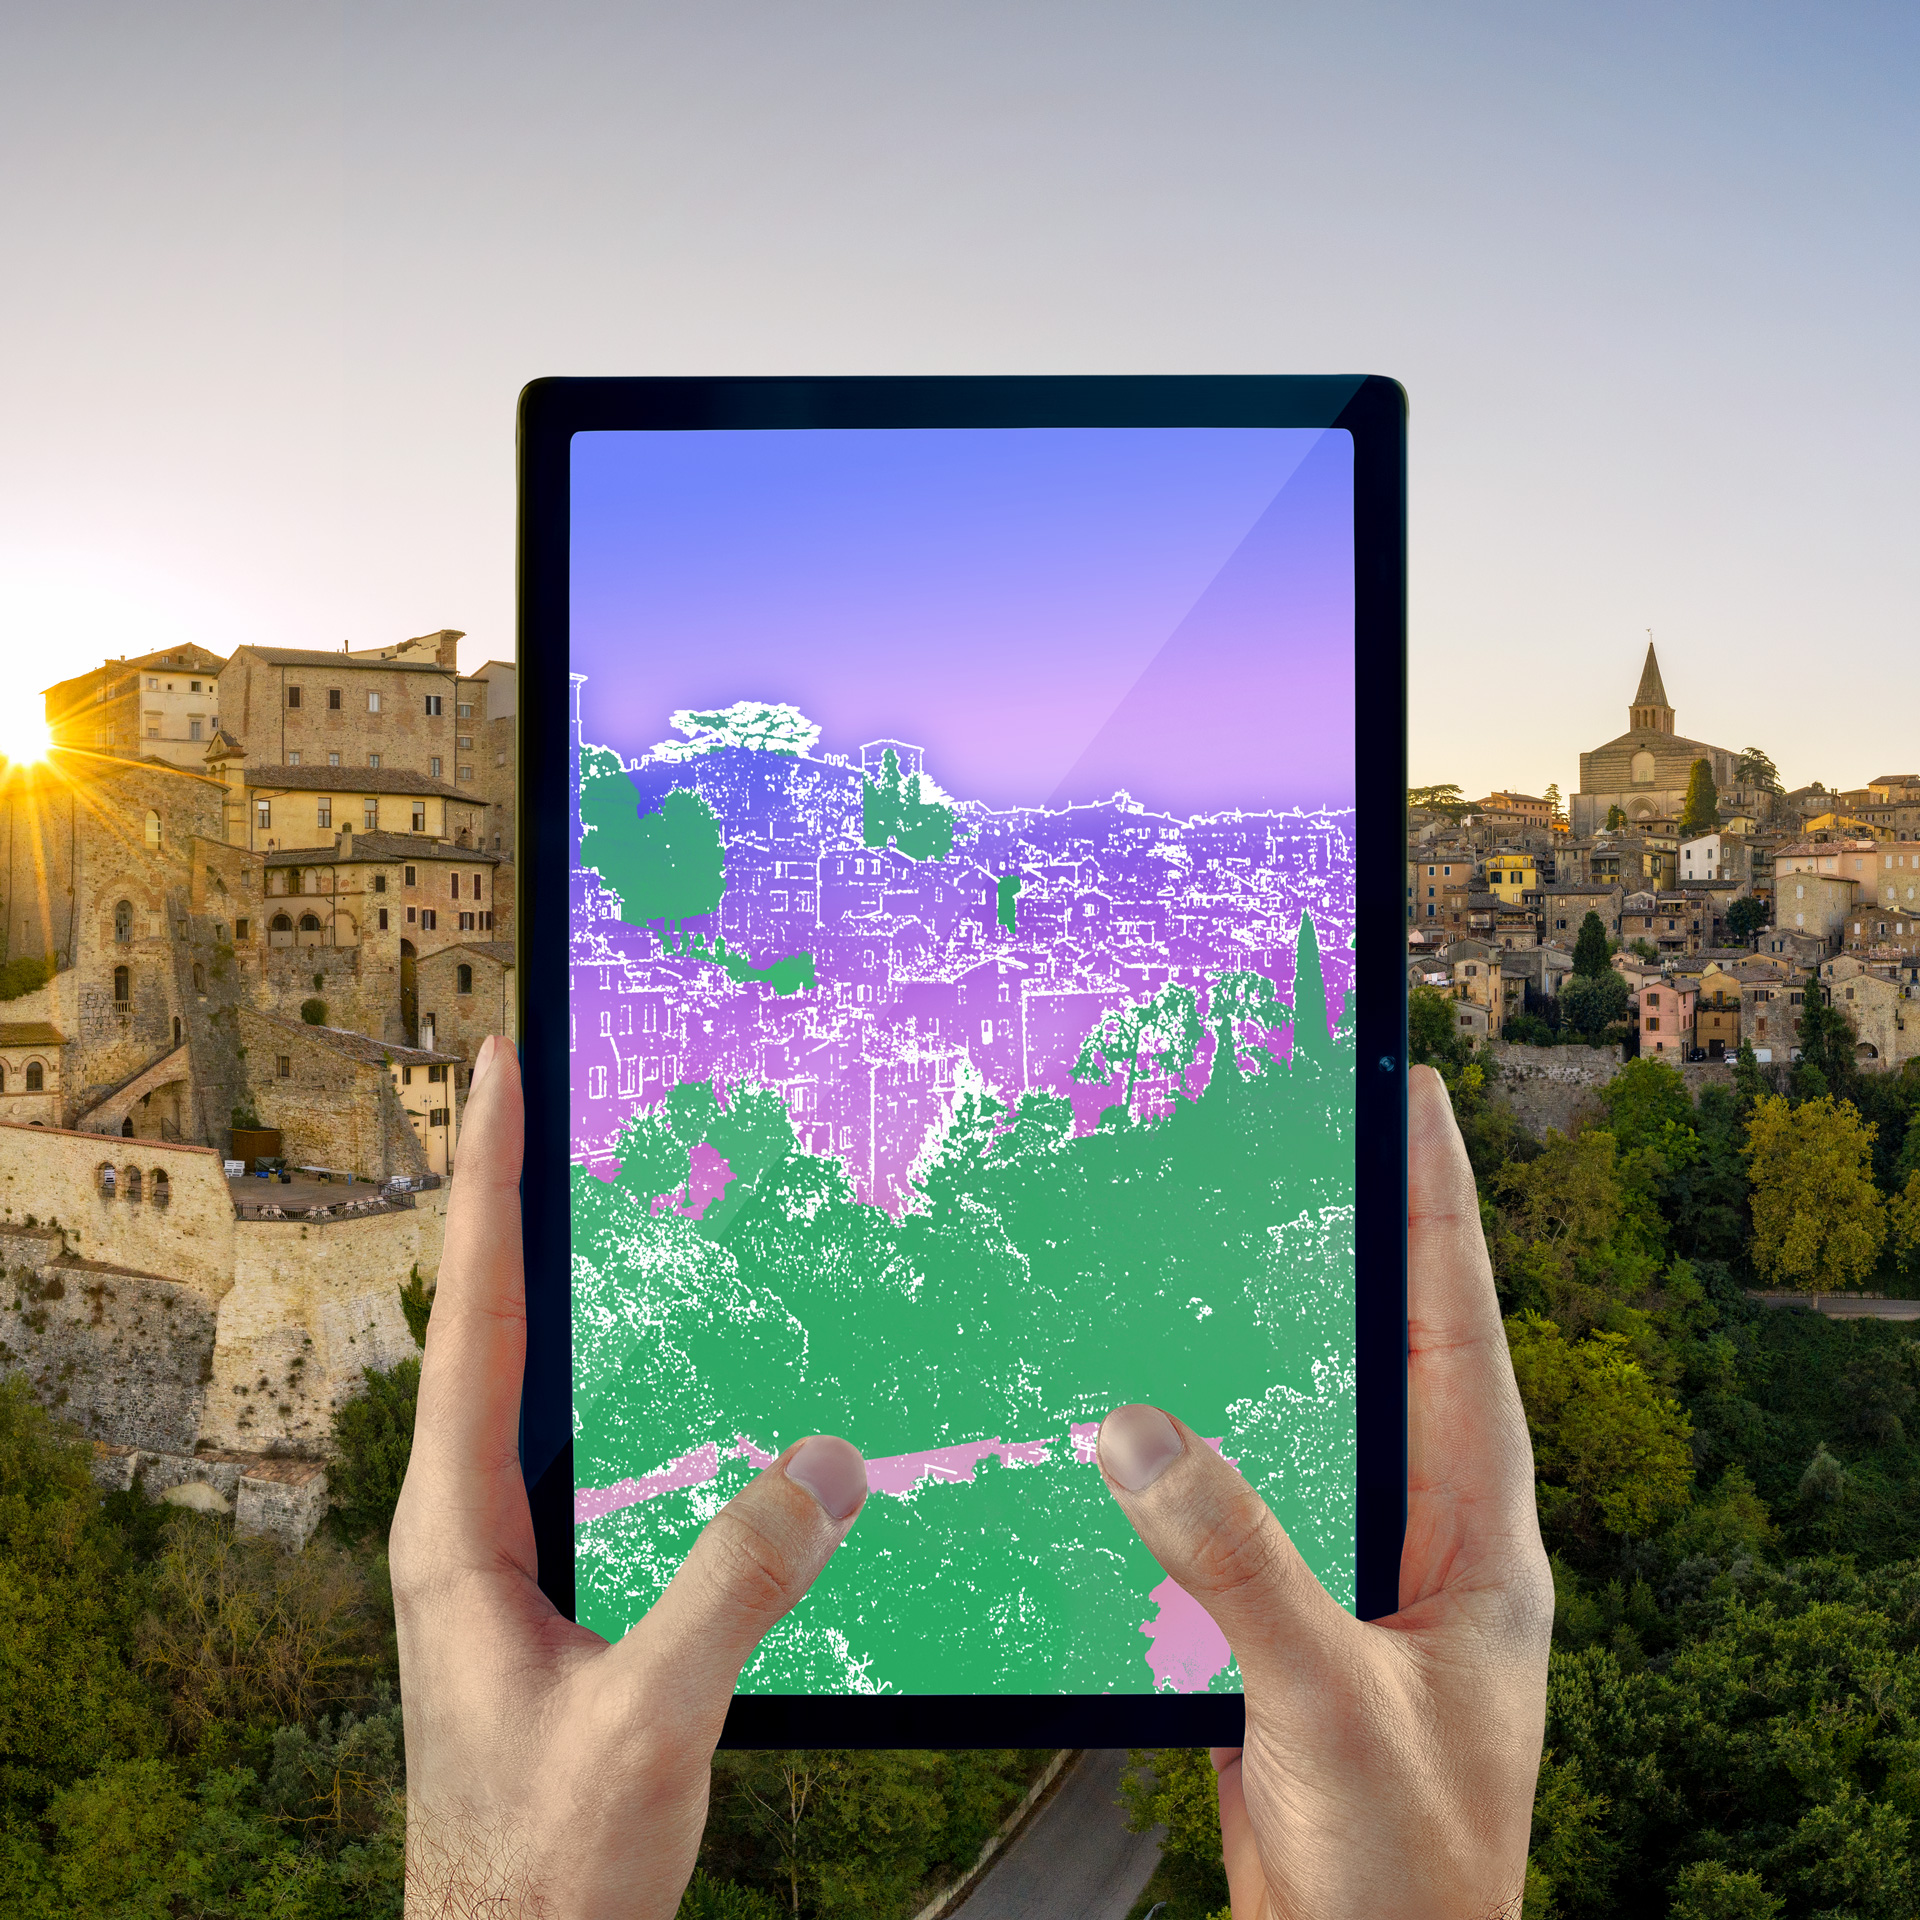
Analysis of Urban Green, thanks to satellite, however, is not only quantitative; it can also be qualitative. The Green Wellbeing Index, using among other data the NDVI (Normalized Difference Vegetation Index), takes a snapshot of what state the vegetation is in: where the green is lush and healthy and where it is in a state of distress, thus suggesting to those in charge of management where and how to intervene to defend the green lung within the city.
Another feature is the automatic calculation of crucial information on the distribution of land consumption, the average area per resident, and the ratio of land consumed to the number of children.
Urban greenery plays a crucial role in improving the environment, with positive impacts on air quality:
- On the reduction of noise pollution,
- on soil stabilization,
- on the preservation of biodiversity,
- on the creation of spaces for outdoor recreation and social interactions.
The Green Dashboard stands as a strategic tool for preserving the city’s green lungs while contributing to the sustainability of Todi by improving the management of green areas and promoting a better quality of life for residents, in line with the Sustainable Development Goals (SDGs) of Agenda 2030.
Benefits: technologies to address urban challenges with timeliness and accuracy
We are talking about tools that ensure constant monitoring of performance and KPIs, providing urban authorities with the technologies to address the urban challenges of the future with greater timeliness and accuracy.
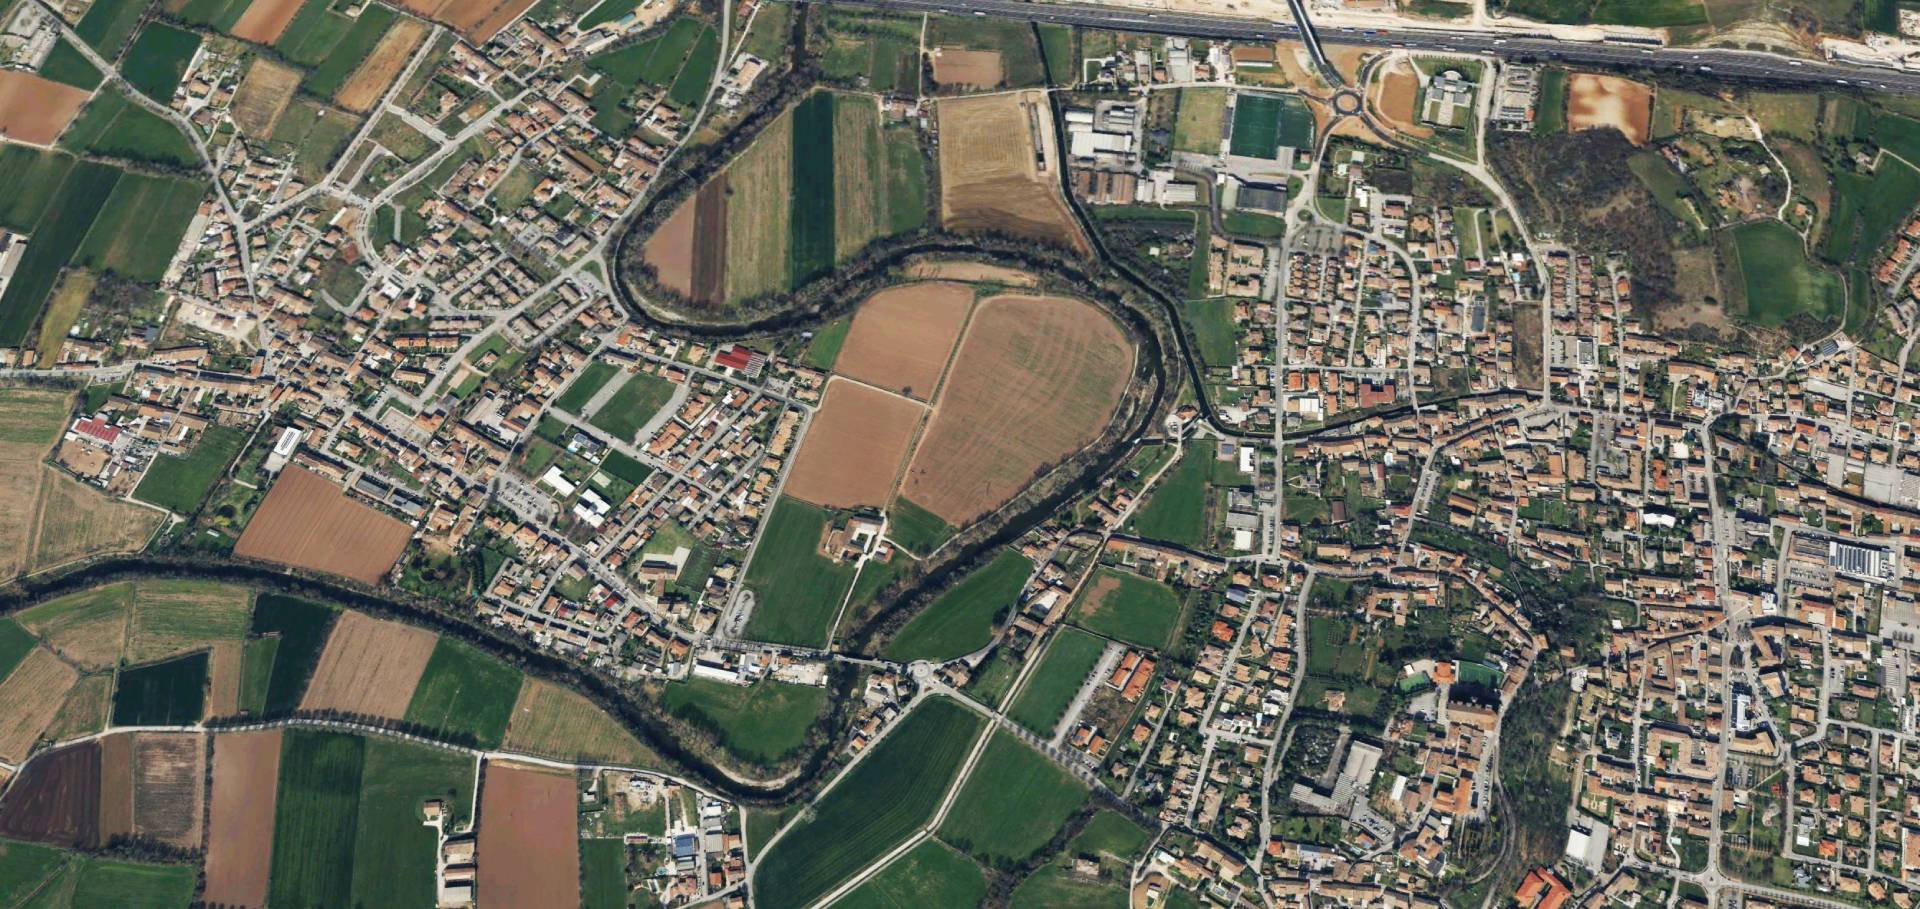
Todi: characteristics of the area
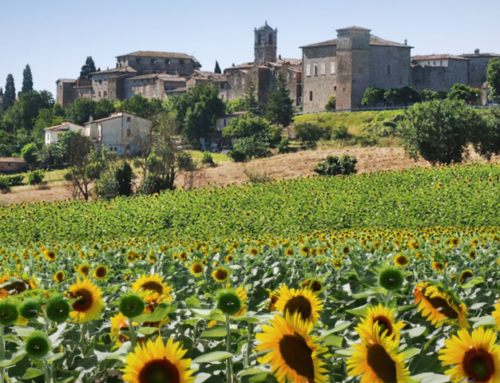
Every year Todi attracts thousands of tourists as this place is an ideal destination for lovers of nature and outdoor activities, offering the opportunity to escape from the stress and chaos of city life to immerse oneself in the rediscovery of the most authentic natural beauty.
Situated in a dominant position over the Tiber Valley, Todi fascinates with its medieval urban layout, whose walls separate the new part from the old town, revealing enchanting views of the Tiber Valley.
With a history dating back thousands of years, Todi boasts numerous historical stratifications and a rich artistic heritage, the pride of its inhabitants, the Tuderti.

Contribution to sustainable urban development
The project aims to contribute to the achievement of the following Sustainable Development Goals of the 2030 Agenda, defined and promoted by the United Nations:


Media talking about the project


Media talking about the project


You might also be interested in
WiseTown® | Piter (Integrated Territorial Platform)

WiseTown® | Geographic Information System Spoleto

WiseTown® | Parma Digital Twin: Innovation for Climate Neutrality 2030

WiseTown® | Narni, digitalized and sustainable municipality
WiseTown® | Todi, a smart and sustainable municipality

WiseTown® | Fratta Todina, technological innovation for the protection of citizens and the territory
WiseTown® | Strategic Roadmap for Digital Innovation of the Municipality of Calcinato

